Incuriosity Will Kill Your Infrastructure
This is a blog about the development of Yeller, The Exception Tracker with Answers
A long while back, the folk working at Boundary at the time coined a phrase that I’ve loved ever since then:
Incuriosity Killed The Infrastructure
The idea it covers has helped me and many other folk since then. It’s a dense phrase, so here’s the idea:
- running a modern software system can be hard work
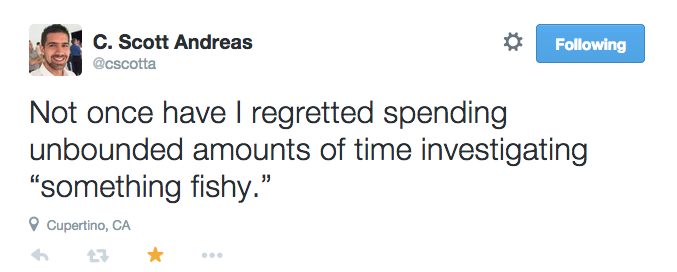
- if you see things that don’t make sense to you, you have to investigate them later, because that’s a sign towards a thing that will mess you up
- and the obvious counterpart: being actively curious about “fishy” things will lead to a more stable and happy infrastructure.
It’s about getting ahead of the game, not about getting paged at 3am and putting your head out with the fire extinguisher every day of the week.
Paying attention to small niggling things that you don’t quite understand pays off with avoided pages.
An example would be handy right about now
I have a good story involving this that I hit recently:
Some Background
First, a little bit of background about Riak (the data store Yeller uses to store exception data).
Riak’s solution for resolving concurrent writes isn’t locking, or transactions, or CAS, or Last Write Wins like many more traditional databases. Instead, it uses Vector Clocks to detect concurrent writes. Vector Clocks let you know
hey, you did a modification that didn’t historically relate to these other operations"
So, Riak, upon detecting concurrent writes, stores both copies of the writes, and then a read after that will return both values. Further writes can say “I descend from these two parent values”, just like a git merge commit. At that point, all concurrent copies that are resolved are cleaned up.
As such, you have to keep track of vector clocks inside your codebase. The typical way to do this is to always read-modify-write every piece of data, typically by supplying a function to the Riak client library. If you don’t do this, you get “sibling explosion”, in which you store many many copies of a particular value, and then destroy the network, riak’s memory use and your client application’s latency by reading in all those thousands of values during each get request.
Guess where this one is going.
Some Meat
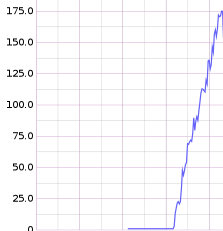
A few weeks ago, I shipped a patch to Yeller that caused a sibling explosion:

You can see the p99 on the number of siblings on the client side explode dramatically.
Incuriosity Killed The Infrastrcture
The real meat of this saying, is how you have to pay attention to weirdness in your infrastructure. Missing the warning signs that things are wrong, or putting it off because “I have more pressing things to do” hurts down the road.
With this sibling explosion, I managed to avoid seeing it in the following cases:
The main dashboard
On the main dashboard for the data ingest of Yeller, I track the “modification” time for each of the main buckets - the p99 time taken for a full read-modify-write cycle. This was chugging along at a happy 0 - no values were hitting it at all.
I looked at that and went “oh, that’s weird, must be a graphite bug”, and continued on.
Distributed JVM Profiling
Courtesy of Riemann, Yeller has a distributed JVM profiler. Whilst investigating another performance issue, I saw that the profiled trace contained a call to my riak library’s get call, which it shouldn’t contain (because everything should go through the modify call)
Again I said to myself “huh, that’s a little weird, but guess it might be that somewhere unimportant or something”
Then I got paged
At 3am
Latency on one of Yeller’s key web pages had spiked like mad. Weird.
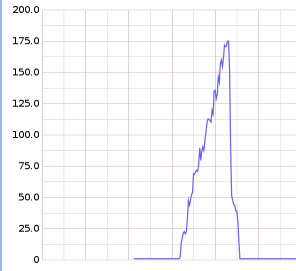
I dug in, using Yeller’s inbuilt webapp profiler. It was saying that the read time on this bucket was up in the hundreds of milliseconds. That was extremely odd. So I turned to the graphite dashboard for that riak bucket and saw this shitshow as the number of conflicting writes:

I fixed the bug (it was a small coding error), and kicked myself. I should have spotted it way earlier, well before getting paged.
Incuriosity had hurt my infrastructure pretty damn badly.
After a deploy and letting the system run for a while, things returned to normal:

Luckily I still spotted this early enough that things weren’t irrevocably broken (the only customer impact from the whole issue was a slow page load or two, which isn’t the best thing in the world, but it’s not awful either).
Takeaways for your operations
The basic principle that’s super important here is:

Sometimes going throug this only teaches you that your understanding of how your system is flawed, but that’s still incredibly valuable - you’re learning this up front, rather than at 3am whilst trying to debug something else.
Paying attention to “fishy” things lets you get ahead of the game with your infrastructure - instead of reacting to fires all the time, you can detect symptoms before they affect customers.
This is a blog about the development of Yeller, the Exception Tracker with Answers.
Learn how to Debug Production Errors
I've put together a course on debugging production web applications. It covers a whole heap of techniques to speed up debugging. Shortcuts you can take, changes you can make to your systems to make debugging easier, common mistakes to avoid and a bunch more.